
consumer information.
Student Achievement Data
Student Achievement Data
North Greenville University identifies, evaluates, and publishes goals and outcomes for student achievement consistent with its mission, the students it serves, and kinds of programs using multiple measures. NGU evaluates four student achievement outcomes; the Integrated Postsecondary Education Data System (IPEDS) Six-Year Graduation Rate (150% standard time), retention rate, Physician Assistance PANCE exam pass rate, and the Teacher Licensure exam pass rates. NGU sets the threshold of acceptability as the minimum value of acceptability for a student achievement metric and the target as the aspiration goal. Table 1 shows the four outcomes with the associated justification, threshold of acceptability value and target value.
Table 1 Student Achievement Criteria
| Criteria | Threshold of Acceptability | Target | |
| IPEDS Six-Year Graduation Rate (KSCI) | 49% | 60% | |
| Appropriateness and Justification | This criterion was selected as the SACSCOC key student completion indicator (KSCI) as measured by the IPEDS overall six-year (150% standard time) graduation rate. | The threshold of acceptability is based on the typical (median over 6 years) graduation rate in six-year performance of our fourteen peer institutions. It is benchmarked based on the performance of this peer comparison group. | The target is based on the typical (median over 6 years) graduation rate in six-year performance of our six aspirational institutions. It is benchmarked based on the performance of this aspirational comparison group. |
Calculation: The percentage of first-time, full-time degree-seeking undergraduate students who complete their program within six years.
| Criteria | Threshold of Acceptability | Target | |
| First-Year Retention Rate | 67% | 76% | |
| Appropriateness & Justification | This criterion was selected because it is a common measure of student achievement with a focus on the undergraduate student population. | The threshold of acceptability is based on the typical (median over 6 years) retention rate of our fourteen peer institutions. It is benchmarked based on the performance of this peer comparison group. | The target is based on the typical (median over 6 years) retention rate of our six aspirational institutions. It is benchmarked based on the performance of this aspirational comparison group. |
Calculation: The percentage of first-time, full-time, undergraduate students who return to school the following fall.
| Criteria | Threshold of Acceptability | Target | |
| PANCE Pass Rate | Varies by year (see PANCE rates) | 100% | |
| Appropriateness & Justification | The Physician Assistant National Certifying Examination pass rate for first-time test takers and all test takers is a measure of the student success in our Physician Assistant Program compared to the national average. | The threshold of acceptability is to stay at or above the national average first-time taker exam pass rate. | Our target is to have 100% first-time taker exam pass rate. |
Calculation: The percentage of first-time PANCE exam pass rate
| Criteria | Threshold of Acceptability | Target | |
| Teacher Licensure | Varies by year (see exam pass rates) | 100% | |
| Appropriateness & Justification | The Praxis 2 and Principles of Learning and Teaching (PLT) exam pass rate is a measure of the student success in our College of Education teacher preparation program compared to the state average. | The threshold of acceptability is to stay within 5% of the statewide average pass rate. | Our target is to have 100% exam pass rate. |
Calculation: The percentage of exam pass rate average of Praxis 2 and PLT scores
Table 2 NGU Six-Year Graduation Rate (KSCI)
IPEDS Six-Year Graduation Rate (150% Standard Time)
| IPEDS Report Year | Fall Cohort | Threshold of Accountability | Actual | Target |
| 2024 | 2018 | 49% | 55% | 60% |
| 2023 | 2017 | 49% | 55% | 60% |
| 2022 | 2016 | 49% | 54% | 60% |
| 2021 | 2015 | 49% | 57% | 60% |
| 2020 | 2014 | 49% | 51% | 60% |
Data Source: IPEDS Graduation Rate 150% survey
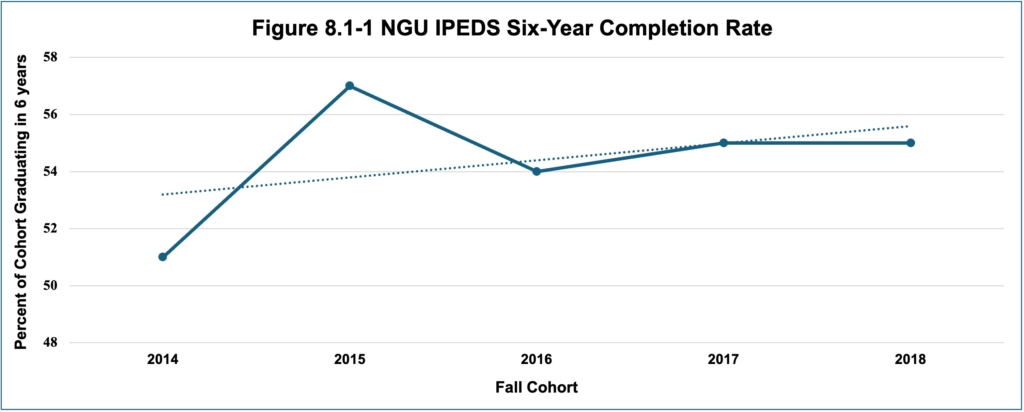
Table 2 shows that each year NGU has documented a six-year graduation rate that is above the threshold of acceptability of 49%. Notably, the NGU six-year graduation rate has stayed consistently around 55% for the past three years.
Data Source: IPEDS Graduation Rate 150% survey
Figure 1 is a pictorial representation of the data from Table 2. Figure 1 shows that the six-year graduation rate fluctuated but has remained above the threshold value of 49%. The positively sloped blue trend line indicates improvement over time.
Table 3 NGU Retention Rates
| IPEDS Report Year | Threshold of Acceptability | Actual | Target |
| 2024 | 67% | 72% | 76% |
| 2023 | 67% | 69% | 76% |
| 2022 | 67% | 71% | 76% |
| 2021 | 67% | 68% | 76% |
| 2020 | 67% | 77% | 76% |
| 2019 | 67% | 72% | 76% |
| 2018 | 67% | 73% | 76% |
Data Source: IPEDS Fall Enrollment Survey
As shown in Table 3, since 2018, NGU first-year retention rates have exceeded the threshold of acceptability established for this criterion of 67%.
Table 4 PANCE First-Time Taker Pass Rates
| Year (Class of) | Threshold of Acceptability (National Exam Pass Rate) | NGU First-Time Pass Rate | Target |
| 2024 | 92% | 93% | 100% |
| 2023 | 92% | 96% | 100% |
| 2022 | 92% | 100% | 100% |
| 2021 | 93% | 100% | 100% |
| 2020 | 95% | 86% | 100% |
Data Source: NCCPA PANCE Exam Performance Summary Report Last 5 Years
The PA PANCE pass rate data (Table 4) show that the NGU PA program has exceeded the institutional threshold of acceptability of scoring greater than or equal to the national exam pass rate for the last 4 out of 5 years. In the PA class of 2020, NGU first-time taker pass rate (86%) fell below the average national exam pass rate that year of 95%. Notably, however, NGU has set an institutional threshold of acceptability that is higher than the ARC-PA accrediting body minimum requirement. NGU has exceeded the Accreditation Review Commission on Education for the Physician Assistant, Inc. (ARC-PA) accrediting body minimum requirement for all reporting years and for two of the last four years, has met the target goal of 100% for first-time taker pass rate.
Table 5 Teacher Licensure Exam Pass Rates
ETS Summary Assessment Teacher Licensure Exam Pass Rates (Praxis 2 Content & PLT Exams)
| College of Education Report Year | Statewide Pass Rate | Threshold of Acceptability (At minimum, within 5% of the statewide pass rate) | NGU Pass Rate | Met/Not Met Threshold of Acceptability | Target |
| 2023-2024 | 90% | ≥85% | 94% | Yes | 100% |
| 2022-2023 | 92% | ≥87% | 92% | Yes | 100% |
| 2021-2022 | 92% | ≥87% | 91% | Yes | 100% |
| 2020-2021 | 95% | ≥90% | 94% | Yes | 100% |
Data Source: Educational Testing Service (ETS) and NGU College of Education
The data in Table 5 shows that NGU education students pass the required teacher licensure exams (Praxis 2 and PLT) above the threshold of acceptability value, which has been established by the College of Education, and is the value within 5% of the statewide pass rate each year.